Profile of the Running ES Score & Positions of GeneSet Members on the Rank Ordered List
| Dataset | Set_03_absentNotch_versus_truncNotch.phenotype_absentNotch_versus_truncNotch.cls #absentNotch_versus_truncNotch.phenotype_absentNotch_versus_truncNotch.cls #absentNotch_versus_truncNotch_repos |
| Phenotype | phenotype_absentNotch_versus_truncNotch.cls#absentNotch_versus_truncNotch_repos |
| Upregulated in class | absentNotch |
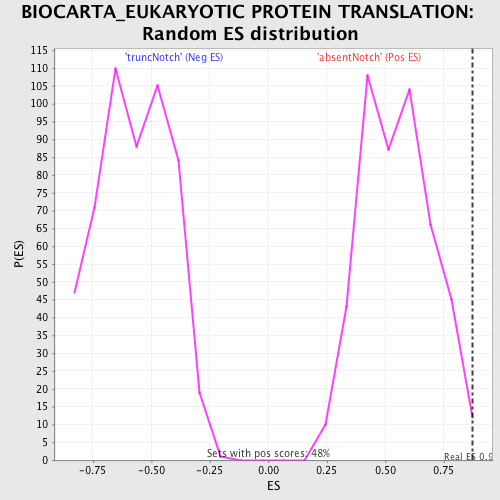
| GeneSet | BIOCARTA_EUKARYOTIC PROTEIN TRANSLATION |
| Enrichment Score (ES) | 0.8711943 |
| Normalized Enrichment Score (NES) | 1.5827602 |
| Nominal p-value | 0.008421052 |
| FDR q-value | 0.2662008 |
| FWER p-Value | 0.948 |
| PROBE | DESCRIPTION (from dataset) | GENE SYMBOL | GENE_TITLE | RANK IN GENE LIST | RANK METRIC SCORE | RUNNING ES | CORE ENRICHMENT | |
|---|---|---|---|---|---|---|---|---|
| 1 | EIF4G3 | 670707 | 185 | 3.687 | 0.2432 | Yes | ||
| 2 | EIF4G1 | 4070446 | 496 | 2.717 | 0.4131 | Yes | ||
| 3 | EIF4A1 | 1990341 2810300 | 687 | 2.341 | 0.5636 | Yes | ||
| 4 | EIF2S2 | 770095 2810487 | 1018 | 1.869 | 0.6742 | Yes | ||
| 5 | EIF4G2 | 3800575 6860184 | 1379 | 1.470 | 0.7558 | Yes | ||
| 6 | EIF5 | 6380750 | 1630 | 1.216 | 0.8258 | Yes | ||
| 7 | EIF4A2 | 1170494 1740711 2850504 | 2011 | 0.958 | 0.8712 | Yes | ||
| 8 | EIF4E | 1580403 70133 6380215 | 3604 | 0.264 | 0.8038 | No | ||
| 9 | EIF2S1 | 5360292 | 6766 | 0.021 | 0.6353 | No | ||
| 10 | EIF5B | 1190102 4200440 | 9216 | -0.021 | 0.5052 | No |